
Appendix 1: Demonstrations
One of the great appeals of nonlinear chemical dynamics lies in the striking visual demonstrations that can be created. It is a rare person who is not impressed the first time he or she sees a clear solution repeatedly turn brown, then blue then back to clear! In this appendix we explain how to perform demonstrations of oscillating reactions, fronts and waves. In the next section we provide information on how some of these systems can be systematically studied in the upper level undergraduate laboratory.
In addition to the demonstrations and experiments we present, there have been many pedagogical articles in the Journal of Chemical Education [Benini, et al., 1996;Epstein, 1989;Field, 1989;Field and Schneider, 1989;Fink, et al., 1989;Glasser, 1989;Hollinger and Zenzen, 1991;Jahnke and Winfree, 1991;Melka, et al., 1992;Noyes, 1989;Pojman, 1990;Pojman and West, 1996;Rosenthal, 1991;Sharbaugh III and Sharbaugh Jr., 1989;Soltzberg, 1989;Strizhak and Menzinger, 1996;Talanquer, 1994;Vemaulpalli, 1990;Weimer and Smith, 1994;Winfree, 1984]. An excellent collection of demonstrations of oscillating reactions and waves appears in Shakhashiri's Chemical Demonstrations: A Handbook for Teachers [Shakhashiri, 1985].
.c2.A1.1 The Briggs-Rauscher Reaction
Although the BZ reaction is the most famous oscillating reaction, the best demonstration is the Briggs-Rauscher reaction [Briggs and Rauscher, 1973]. It oscillates dependably, colorfully and rapidly, making it an ideal classroom demonstration. Two recipes are often used, one with 30% hydrogen peroxide and one with 3%. We will only present the latter, because the concentrated hydrogen peroxide is not readily available; both recipes work equally well.
We will describe how to prepare a total of three liters of solution.
Solution (1) is just drugstore (3%) hydrogen peroxide.
Solution (2) is prepared by placing 29 g of potassium iodate (KIO3) (26 g of NaIO3 can be substituted) and about 400 mL of distilled water in a 1 liter beaker. Add 8.6 mL of 6.0 M H2SO4. (To prepare a stock solution of 6.0 M sulfuric acid, carefully pour 330 mL of concentrated [18 M] sulfuric acid into 500 mL of distilled water and dilute to 1.0 L.) Stir the solution until the iodate dissolves (this may require some heating -- sodium iodate will dissolve more readily).
Solution (3) is prepared by dissolving 10.4 g of malonic acid and 2.2 g of manganese (II) sulfate monohydrate (MnSO4 · H2O) in about 400 mL of distilled water in another 1 L beaker. In a 100 mL beaker, heat 50 mL of distilled water to boiling. In a 50 mL beaker mix 0.2 g of soluble starch with about 5 mL of distilled water and stir the mixture to form a slurry. Pour the slurry into the boiling water and continue heating and stirring the mixture until the starch is dissolved. (NB: This step is crucial, because if the starch is not dissolved, the oscillations will not be visible.) Pour the starch solution into the malonic acid/manganese sulfate solution. Dilute it to 500 mL.
Pour equal volumes of (2) and (3) into a beaker equipped with a magnetic stir bar. (The demonstration can be performed without mixing, but the transitions will not be as sharp as with mixing.) Add a volume of (1) equal to the sum of (2) and (3). An amber color will appear quickly, then turn to deep blue. The blue will disappear, leaving a clear solution. Copious bubble production will accompany these changes. The sequence will repeat; the period of oscillation is initially about 15 seconds, but it will increase until, after several cycles of oscillation, the reaction remains deep blue.
A large amount of I2 will be produced. The beaker should be kept covered, e.g., with parafilm, to keep the vapors from escaping. The solid iodine that remains at the end of the reaction should be reduced to iodide by the addition of 5 g per liter of demonstration solution of sodium thiosulfate. This reduction can be quite exothermic! The cold solution should be flushed down the drain with large amounts of water.
.c2.A1.2 The Belousov-Zhabotinsky Reaction
Prepare the following solutions in de-ionized water.
A) 19 g KBrO3 (or 17 g NaBrO3) dissolved in enough water to make a 500 mL solution. [BrO3] = 0.23 M.
B) 16 g of malonic acid and 3.5 g of KBr (3.0 g NaBr) dissolved in enough water to make a 500 mL solution. [MA] = 0.31 M; [Br] = 0.059 M.
C) 5.3 g cerium(IV) ammonium nitrate dissolved in enough 2.7 M sulfuric acid to prepare 500 mL. [Ce(NH4)2(NO3)6] = 0.019 M (To prepare a stock solution of 2.7 M sulfuric acid, carefully pour 149 mL of concentrated [18 M] sulfuric acid into 500 mL of distilled water and dilute to 1.0 L.)
D) 3.6 g of methylmalonic acid (Aldrich), instead of malonic acid in solution B and 0.70 g KBr in 100 mL water.
Add solutions A and B to a 2 L flask equipped with a magnetic stir bar. The solution will become brown from bromine formation. After the solution clears, add solution C and 30 mL of 25 mM ferroin (Fisher). The solution will change from green to blue to violet and then to red over a period of about a minute. These oscillations will persist for about 20 minutes.
A smaller version can be prepared using appropriately scaled volumes.
Substituting solution D for C will produce an oscillator with an initial period of 3-5 minutes that will continue oscillating for 8 hours! The period will gradually lengthen to 15 minutes.
Safety Information
Bromates are strong oxidizing agents and should be treated with caution. Spills of sulfuric acid should be neutralized with bicarbonate.
The completed reaction can be neutralized with bicarbonate and flushed down the drain with copious amounts of water.
.c2. A1.3 BZ Waves
Prepare the following solutions:
A) Dissolve 84 g of KBrO3 (or 69 g of NaBrO3) in 750 mL of 0.6 M sulfuric acid. (To prepare the acid solution, carefully pour 33 mL of concentrated [18 M] sulfuric acid into 500 mL of distilled water and dilute to 1.0 L.) Dilute to 1.0 L with more acid. [BrO3] = 0.50 M.
B) Dissolve 52 g of malonic acid in 750 mL of distilled water and dilute to 1.0 L. [malonic acid] = 0.50 M.
C) Dissolve 1g of NaBr in 10 mL of distilled water. [NaBr] = 0.97 M.
D) 25 mM ferroin (Fisher). Make sure the ferroin is the sulfate version and not the chloride salt.
Into a small Erlenmeyer flask, introduce 7 mL of (A), 3.5 mL (B) and 1 mL of (C). Stopper and allow to stir on magnetic stirrer. The brown color is bromine which forms from the oxidation of bromide by bromate. The bromine slowly disappears as it reacts with the malonic acid to form bromomalonic acid. When the solution has cleared, add 1.0 mL of ferroin (D) and stir.
The reaction may oscillate between red and blue, but ignore this. Use a pipette to transfer sufficient solution to form a thin (1-2 mm) layer in a clean petri dish. Cover the dish and wait. To demonstrate the waves to class using an overhead projector, it is essential to have a thin layer. Wetting the surface of a petri dish can be achieved by adding a surfactant [Field and Winfree, 1979]. Sodium dodecyl sulfate works well. Adding a small amount of ultrafine silica gel (CAB-O-SIL, Cabot Corp.) eliminates convection, but the solution remains sufficiently translucent to allow projection.
Rings will spontaneously appear after a few minutes (see Figure 6.6). To create spirals, gently break a wave using a pipette. Two counter rotating spirals will slowly form (Figure 6.7).
Safety and disposal information are the same as for the BZ oscillating reaction.
.c2.A1.4 A Propagating pH front
This is a very simple reaction to perform in order to show how an autocatalytic front propagates and how convection affects such a front. The reaction is also described in [Summerlin, et al., 1988] and was studied by Nagy and Pojman [Nagy and Pojman, 1993].
A solution initially contains sulfite/bisulfite and chlorate with the pH indicator bromophenol blue. No reaction occurs until some 3 M sulfuric acid is added. The solution rapidly turns yellow as the pH drops.
ClO3 + 3 HSO3 Æ Cl + 3SO42 + 3H+
If the solution initially contains 0.88 M SO32 and 0.12 M HSO3, the reaction rate is effectively zero at 298 K. If no sulfite is present, then the bisulfite can disproportionate
2HSO3 ¤ H2SO3 + SO32 K2/K1 = K = 5.56 x 10⁶
The presence of the sulfite suppresses the reaction, and the pH remains above 7.
If a strong acid is added, then H+ reacts with sulfite
SO3 + H+ ¤ HSO3 1/K2 = 1.0 x 10⁷
Given the value of the equilibrium constant, and the excess of sulfite, all the H+ is converted to bisulfite. The increased bisulfite and decreased sulfite shifts the bisulfite/H2SO3 equilibrium to form H2SO3. The H2SO3 can react with the chlorate to produce more H+. This H+ will protonate sulfite, replacing the bisulfite and in turn the H2SO3 consumed. The key is that as the concentration of sulfite decreases during the reaction, the bisulfite disproportion equilibrium will shift farther to the right, increasing the concentration of H2SO3. Thus, the pH remains nearly constant until enough sulfite is reacted to leave the system unbuffered. Then, all the H+ produced will protonate the bisulfite, and the reaction can "explode".
The recipe is simple: 4 g potassium chlorate, KClO3, (or 3.3 g sodium chlorate) and 12.5 g sodium sulfite, are dissolved in about 75 mL of distilled or deionized water. Add a few mg of bromophenol blue. (The solution should be a dark blue.) Slowly add 4 mL of 3 M sulfuric acid while the solution is stirred, and dilute the solution to a final volume of 100 mL with water. The solution should be dark blue (basic). Pour the solution into a graduated cylinder or test tube and add a few drops of 3 M acid to the top without stirring. A yellow solution will appear at the top, and the reaction will propagate down the tube. Convective fingering can be observed (see Figure 9.9).
The reaction is extremely exothermic, and the temperature difference between reacted and unreacted regions is about 50 C. After the reaction cools down, it can be neutralized with bicarbonate and poured down the drain.
.c.Appendix 2: Experiments for the Undergraduate Lab
.c2.A2.1 Frontal Polymerization
We describe a simple and inexpensive experiment with propagating fronts of addition polymerization. The method can be used to determine the front velocity dependence on the initiator concentration and determining the effects of heat loss and gravity on a chemical reaction. This experiment is also described in [Pojman, et al., ].
Propagating fronts can be created with many monomers including acrylamide, butyl acrylate, methacrylic acid, methyl methacrylate, and triethyleneglycol dimethacrylate (TGDMA) [Pojman, 1991;Pojman, et al., 1992;Pojman, et al., 1995;Pojman, et al., 1993;Pojman, et al., 1995]. We chose TGDMA because of its high boiling point that reduces the risk of explosion and the fact that it forms a crosslinked product that will not undergo fingering (see Figure 11.9).
A2.1.1 Experimental
Six reactions are employed in this experiment. Four are used to determine the front velocity dependence on the initiator concentration. The other two demonstrate the effects of convection and heat loss on the reaction.
Safety Information.
Benzoyl Peroxide (BPO) should not be heated.
Triethylene Glycol Dimethacrylate (TGDMA) should be kept cool.
Dimethyl Aniline (DMA) should be kept in the hood. Do not get this compound on your skin.
Do not heat solutions of monomer and initiator, as they will polymerize very rapidly.
Do not expose skin to either BPO or TGDMA. Gloves should be worn at all times. Safety glasses must be worn during this experiment. All reactions should be performed in a working fume hood behind shatterproof glass.
The test tubes containing the traveling front will be very hot--above 200 C, so they should be allowed to cool for at least an hour before handling.
Any unused monomer/initiator solution can be stabilized by adding a few grams of hydroquinone and disposed of as another other organic waste.
Propagating Front Velocity
Three 100 mL solutions of benzoyl peroxide (BPO) in TGDMA are prepared with concentrations between 1 g/100 mL - 4 g/100 mL. The solutions are stable at room temperature for a few hours and should be prepared and used in the same lab period. (Initiator/monomer solutions may be refrigerated for a day or two if necessary.) Benzoyl peroxide does not dissolve quickly in TGDMA above 4g/100 mL. NB: The solution should not be heated to speed dissolution, because polymerization will occur.
The students should record the position of the front as a function of time. This can be done by either making centimeter markings on the test tube or placing a ruler beside the test tube. We suggest using five 16 x 150 mm and one 22 x 150 mm test tubes. The size of the tube makes a difference, as it changes the amount of heat lost to the surroundings. If the tube is too small, then the heat losses will quench the front.
A 16 x 150 mm test tube is arranged in a hood so that the markings (or ruler) can be easily seen. Then, one of the solutions is poured into the test tube. The tube is clamped to a ring stand and a small aliquot (~1-2 mL) of dimethyl aniline (DMA) is added to the top of the tube. (DMA reacts with BPO via a redox process and produces free radicals that initiate polymerization, releasing heat.) The DMA is mixed with the first centimeter of solution, and a reaction should be observed almost immediately. A soldering iron can be substituted for DMA. The hot soldering iron is inserted into the first centimeter of solution to initiate the reaction. Those using a soldering iron should take care that the iron is not too hot, as the solution can splatter out of the test tube.
Once the reaction has begun, it is allowed to proceed for about two or three centimeters down the tube. This is done to allow enough time for the front to stabilize. Then, the time at which the front reaches each centimeter mark is recorded, and a plot of position versus time is made for each of the three solutions. (A video camera can be used to obtain more precise data.)
Heat Loss
The effect of heat transfer on the front is investigated in two ways. First, the tube size is changed from the 16 x 150 mm tube to the larger 22 x 150 mm tube. Second, the reaction is run with the smaller tube in a water bath. The first experiment changes the surface to volume ratio; the second changes the heat transfer coefficient between the tube and its surroundings.
Because the polymer formed is cross-linked, the effect of initiator concentration on the molecular weight distribution cannot be studied. Other monomers (methacrylic acid, butyl acrylate) can be used for such a study but they require additional techniques and equipment. See references [Pojman, et al., 1996;Pojman, et al., 1995] for more information.
A2.1.2 Typical Results
The front velocity is the slope of a plot of front position versus time. This plot is prepared for each concentration, and the data are compared with the predictions of the steady-state model. Students observe that as the initiator concentration increases the velocity of the front increases according to a power function.
Heat losses in a propagating front have a significant effect upon the front velocity. This is related to two factors: the size of the tube that affects the surface to volume ratio, and the medium outside the tube that affects the rate of heat conduction. If the tube diameter is decreased, the front travels slower. In tubes of the size we have used, the polymerization front stops when the vessel is placed in room temperature water, because water conducts heat more effectively than air.
Changing the orientation of the test tube demonstrates the effects of gravity on the front. If a well-established front is inverted, the hot reaction zone rises quickly to the top of the mixture, and the front may be extinguished, depending on the tube diameter and viscosity. If the tube is tilted, the front re-orients so that is perpendicular to the gravitational vector (see Figure 11.8). These effects occur because the hot liquid reaction zone is trapped between cold, dense monomer below and solid polymer above. Buoyancy forces the reaction zone to remain above the monomer layer.
.c2.A2.2 Oscillations in the Homogeneous Belousov-Zhabotinsky Reaction
The goals of the experiment are:
1. To observe spontaneous temporal self-organization.
2. To observe and measure the induction period and determine how it is affected by the organic substrate used.
3. To understand the use of electrodes and the physical chemistry behind their operation.
4. To understand what a redox indicator is and to determine if ferroin acts purely as an indicator or affects the reaction dynamics.
5. To determine the effects of chloride ion and oxygen.
A2.2.1 Experimental
The electrical potential of the reaction mixture is measured with a platinum electrode and a Hg/Hg2SO4 reference (available from Rainin). The output can be recorded on a single-channel strip chart recorder, with the platinum electrode attached to the positive terminal and the reference to the negative, or the recording can be made via a high impedance input to an A/D board on a computer (see Chapter 3).
The recipe has been obtained from Shakhashiri [Shakhashiri, 1985].
Prepare the following solutions in de-ionized water using volumetric glassware.
A) 3.4 g NaBrO3 dissolved in enough water to make a 100 mL solution.
[NaBrO3] = 0.23 M (A1).
50 mL of A1 diluted to 100 mL (A2).
50 mL of A2 diluted to 100 mL (A3).
B) 3.2 g of malonic acid and 0.70 g of KBr dissolved in enough water to make a 100 mL solution. [MA] = 0.31 M; [KBr] = 0.059 M.
C) 0.14 g cerium(IV) ammonium nitrate dissolved in enough 2.7 M sulfuric acid to prepare 100 mL. [Ce(NH4)2(NO3)6] = 0.019 M.
D) 3.6 g of methylmalonic acid (Aldrich), instead of malonic acid in solution B.
Now add 15 mL each of A1 and B to a 100 mL beaker equipped with a stir bar. A brown color will appear because of the production of bromine, which disappears as it reacts with the malonic acid. When the solution clears, add 15 mL of C, and position the electrodes immediately so that the induction period may be accurately observed and measured. Stir at a low rate, or oscillations may be inhibited. The recorder may be set at any desired speed (typically about 1 cm/min). The voltage scale is usually set at either 250 or 500 mV.
Note the time the oscillations commence, the induction period. Also record the period of the oscillations and the amplitude (number of mV during one oscillation).
Students are asked to consider these questions and perform the following procedures:
1. After several periods of oscillations, add 2 mL of a 25 mM ferroin solution (available from Fisher). Ferroin (tris(1,10-phenanthroline)iron(II) sulfate) is a redox indicator. As the [Ce(IV)] increases, it can oxidize the iron in ferroin from iron(II) to iron(III). The iron(II) complex is red and the iron(III) is blue; consequently the color changes as the potential changes. What effect does the ferroin have on the period and amplitude of the oscillations? Is it really acting just as an indicator?
2. Test the effect of Cl by adding a small grain of NaCl. What happens? How long does it take the system to recover (if at all)? Add a pinch. What happens?
3. Test the effect of stirring on the system by turning the stirrer to a high speed. Turn it up to full speed. Are the oscillations affected?
4. Field, Körös and Noyes[Field, et al., 1972]have proposed a mechanism in which radicals play important roles (BrO2·, MA·) Add a drop of acrylonitrile to an oscillating reaction and explain the relevance of the white precipitate [Váradi and Beck, 1973].
5. Observe oscillations for half an hour. Note changes in the period as a function of time. What is the relevance of this change to the Second Law of Thermodynamics?
6. Prepare a fresh reaction mixture using solution A2. Does it oscillate? If it does, what is the period? Try with A3.
7. Finally, set up an experiment with methylmalonic acid (D) and solution (A1) and leave it running for several hours.
A2.2.2 Typical Results
Figure A.1 shows digitized data for the platinum and bromide electrodes.
Figure A.1 Typical time series for BZ reaction.
The amplitudes of A1, A2, and A3 are approximately the same. The periods of oscillation became increasingly longer with decreased bromate ion concentration.
The addition of ferroin reduced the amplitude and the period. Because the Fe(II) (ferroin) is available to reduce the Ce(IV) back to Ce(III), the oscillations may occur faster. Ferroin itself can also catalyze the BZ reaction.
Adding a grain of salt slightly decreases the amplitude and period. Adding more salt can suppress oscillations. The added chloride ions are oxidized to chlorous acid (HClO2), which is then able to reduce the Ce(IV) back to Ce(III), inhibiting oscillations. Oscillations return when the chlorous acid is completely oxidized to inert ClO3 [Jacobs and Epstein, 1976].
Increasing the stirring rate until vortexing occurs entrains oxygen into the system [Farage and Janjic, 1980;Farage and Janjic, 1981]. The oscillations cease because the oxygen molecules are able to react with malonyl radicals that are present in the reaction via an autocatalytic process that increases the radical concentration. The malonyl radicals react with bromomalonic acid, liberating Br. The net effect of oxygen is to increase the bromide concentration beyond the range allowable for oscillations [Field and Burger, 1985]. When the stirring rate is reduced, the oscillations resume.
Addition of large amounts of acrylonitrile stops oscillations for about 20 minutes and a white precipitate (insoluble polymer) forms. See Chapter 11 for a discussion.
With methylmalonic acid as the substrate, the period increases by a factor of about nine and the induction period by a factor of about thirteen.
If data are digitized then it is possible to create phase plots such as Figure 4.5. If a bromide electrode is unavailable, a pseuodophase plot can be constructed by using the time delay method in which the platinum potential is plotted versus the potential at a fixed later time interval (see section 8.3.2). Figure A.2 compares phase plots prepared by both methods.
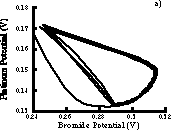
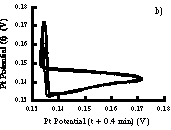
Figure A.2 a) Phase plot prepared by plotting platinum vs. bromide electrode potentials. b) Phase plot prepared by using time delay technique with only platinum electrode.
.c2.A2.3 Unstirred BZ System: "Measuring Rate Constants with a Ruler"
In this experiment we determine the rate constant of an important autocatalytic reaction in the BZ reaction, where Red is the reduced and Ox is the oxidized form of the metal catalyst.
3H+ + BrO3- + HBrO2 + 2Red --> 2HBrO2 + 2Ox + H2O
d[HBrO2]/dt = k [H+][BrO3][HBrO2] (A.1)
However, measuring k directly is difficult because we can not run an experiment in a beaker in which we mix bromate and HBrO2 in acid solution (HBrO2 is not a stable species). In the BZ system, the formation of HBrO2 is accompanied by the oxidation of the metal ion, which we observe as a propagating color change. Tyson proposed the following expression for the wave velocity in terms of the HBrO2 diffusion coefficient and the rate constant of the autocatalytic reaction [Tyson, 1985].
Velocity = 2(kD[H+][BrO3])1/2 (A.2)
D is the diffusion coefficient of HBrO2 (2 x 10 5 cm2/s).
The goals of this experiment are:
1. To test this model by determining the sensitivity of the front velocity to the concentrations of ferroin, [BrO3]0, and [H+]0.
2. To use these data to calculate a value for k.
3. To observe the phenomenology of waves and spirals.
A2.3.1 Experimental
The following solutions are prepared in advance (see demonstration section for recipes):
A) 100 mL 0.6 M NaBrO3 / 0.6 M H2SO4
B) 40 mL 0.48 M Malonic Acid
C) 25 mM Ferroin (Fisher)
D) 0.97 M NaBr (1g/10 mL)
Students prepare the following additional solutions:
Take 40 mL of (A) and dilute to 50 mL (A1). 0.48 M NaBrO3 / 0.48 M H2SO4.
Take 20 mL of (A1) and dilute to 25 mL (A2). 0.38 M NaBrO3 / 0.38 M H2SO4.
Take 10 mL of (A) and dilute to 20 mL (A3). 0.3 M NaBrO3 / 0.3 M H2SO4.
The following procedure is from [Epstein, 1987].
Into a small Erlenmeyer flask, introduce 7 mL of (A), 3.5 mL (B) and 1 mL of (D). Stopper and stir with a magnetic stirrer. The orange-brown color is bromine which forms from the oxidation of bromide by bromate. The bromine slowly disappears as it reacts with the malonic acid to form bromomalonic acid. When the solution has cleared, add 0.5 mL of the 25 mM ferroin solution and stir.
The reaction may oscillate between red and blue, but ignore this. Use a pipette to transfer sufficient solution to a clean petri dish. Cover the dish and wait.
Students are asked to consider these questions and perform the following procedures:
1. You will notice small rings of blue forming in the red solution. Notice how rapidly the blue color spreads. Calculate how long a molecule would take to diffuse just one cm (D 105 cm2/s, distance (Dt)1/2). Clearly, simple diffusion can not account for the speed of color propagation.
2. You will see bubbles form. What are they? Recent work indicates that they are not CO2, but CO [Ouyang, et al., 1987]. If too many bubbles form to see the waves clearly, swirl the dish around. New waves will form.
3. What happens when two waves collide? How is this different from what happens with water waves?
4. What happens when a wave encounters a barrier? Does it reflect?
5. To make a spiral, slowly move a pipette tip through the center of a target pattern. Which direction does the spiral rotate?
6. Repeat the above experiment. Use graph paper to measure the change in the radial distance of the wave from the center of a target pattern as a function of time. The slope of a line drawn through these data will provide the wave speed. Also measure the wavelength (the distance between fronts).
7. Does the velocity remain constant with time? If not, why?
8. Repeat these measurements for the following solutions.
a) Use 0.2 mL ferroin instead of 0.5 mL with solution (A). Is there any effect?
b) Using 1.0 mL ferroin and the same volumes of other reagents, make velocity and wavelength measurements for solutions (A1), (A2), (A3).
9. Plot the velocity as a function of the square root of the product of [H+] and [BrO3]. Fit a line. Using the slope and the diffusion coefficient of HBrO2, calculate the rate constant of the autocatalytic reaction. Compare it to the reported value of 20 M2 s1.
10. Does the velocity depend on the ferroin concentration?
A2.3.2 Typical Results
As the concentrations of BrO3 and sulfuric acid are decreased, the wave velocity decreases. A plot of the square of the velocity vs. [H+][BrO3] was also constructed to solve for k from eqn. A.2 because the slope = 4kD. Using nothing more than a ruler and a stopwatch, physical chemistry lab students at the University of Southern Mississippi prepared Figure 6.12, whose slope is 4.1 cm2min2M2 (Figure 6.12). A rate constant of 14 M2s1 was calculated using a diffusion coefficient for HBrO2 of 2 x 105cm2/s [Tyson, 1985]. The percentage deviation from the literature value of 20 M2s1 is 30%, based on the experiments of Field and Noyes[Field and Noyes, 1974] and Showalter [Showalter, 1981].
For each concentration of bromate ion/acid, several velocity measurements were recorded. Data collected from the same samples do not indicate substantial change of the velocity with time. Keeping [BrO3][H2SO4] constant, the ferroin concentration was increased from 0.5 mL to 2 mL. The average velocity of the waves decreased from 0.65 cm/min to 0.64 cm/min when the ferroin concentration was increased. With a standard deviation of ± 0.03 cm/min, this is not a significant decrease. Eqn. A.2 predicts that the front velocity should be independent of the ferroin concentration.
Several qualitative observations of the unstirred BZ system were made. The chemical waves in the reaction mixture did not behave like water waves. When one of the blue waves ran into a wall, no reflection was observed. The wave simply terminated. This observation is in agreement with the grass/fire analogy. If a fire encounters a barrier that it cannot penetrate, it will eventually die out, not reflect back to where it had already burned. Also, when two waves collided, there was no interference. Again, the waves annihilated one another.
Superior results can be obtained if the wave are video taped and the front position determined off the monitor using a ruler, or better yet, with image analysis software [Pojman and West, 1996].
In order to achieve accurate results from this experiment, convection
must be eliminated. An open container allows evaporation, causing temperature
gradients and convection. Even if the there is no air/solution interface,
concentration and temperature gradients are generated by waves, which can
cause convection (see Chapter 9). To eliminate convection, the reaction
can be performed in a gel. A simple approach is to add ultrafine silica
gel (CAB-O-SIL, Cabot Corp.). However, reducing the thickness of the solution
layer also reduces convection substantially. Such thin layers are difficult
to create, because the solution will not wet the petri dish. Using a surfactant
such as TRITON X [Field and Winfree, 1979] or sodium dodecyl sulfate (SDS)
can help.